The stock market can be a volatile place, and investors need to be aware of signs that could indicate an upcoming market crash, so you can save your portfolio!
In this article, we’ll discuss 10 signs that you should watch for to help protect your investments. We’ll also include relevant statistics to help you better understand the significance of each sign.
Overvalued Stocks: Portfolio Killers
Overvalued stocks, or stocks that are priced higher than their actual value, can be a sign of a market bubble that could eventually burst and lead to a crash.
To identify overvalued stocks, look at the price-to-earnings (P/E) ratio. If the P/E ratio is significantly higher than the average, it could indicate that the stock is overvalued.
For example, during the dot-com bubble of the late 1990s, the average P/E ratio of tech stocks was over 200, compared to the historical average of 15-20.
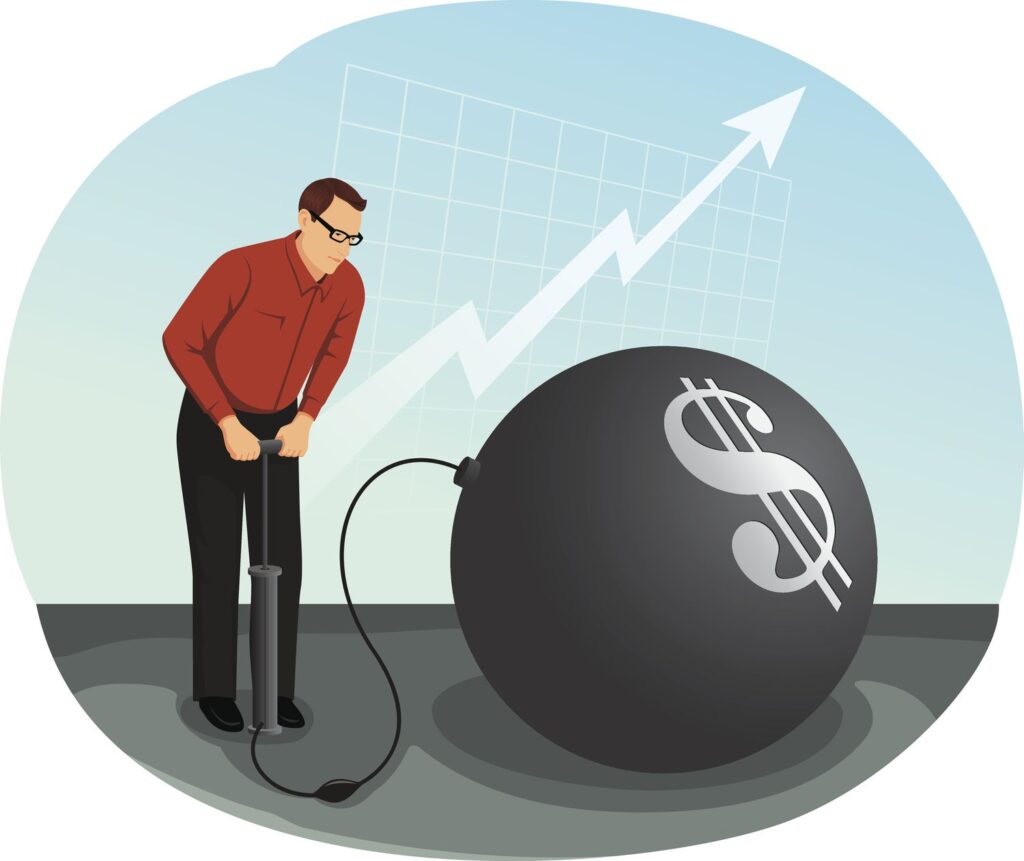
High Market Volatility
High market volatility, or large price swings in a short period, can be a sign of an upcoming market crash. The Volatility Index (VIX), also known as the “fear gauge,” measures the market’s expectation of volatility.
If the VIX is rising, it could indicate that investors are becoming more nervous and that a market crash could be imminent. For example, during the 2008 financial crisis, the VIX rose from below 20 to over 80 in a matter of weeks.

Economic Slowdown: Reshuffle Your Portfolio!
A slowing economy can be a sign of an upcoming market crash. When the economy is in a recession, companies may struggle to make profits, which can lead to a decline in stock prices.
To keep an eye on the economy, you can look at key indicators such as gross domestic product (GDP), unemployment rates, and consumer confidence. For example, prior to the 2008 financial crisis, the US economy was growing at a slower rate and unemployment was on the rise. In cases such as these, it is advisable to shift your capital from stocks to bonds, so as to keep generating revenue and profits

Increased Selling Volume
Increased selling volume, or a high number of shares being sold, can be a sign that investors are becoming nervous and exiting the market. If selling volume continues to rise, it can cause prices to decline, potentially leading to a market crash.
For example, during the 2008 financial crisis, selling volume on the New York Stock Exchange (NYSE) reached record levels, with billions of shares being sold in a single day.

Historical Patterns: How Has Your Portfolio Performed In The Past?
History has a way of repeating itself, and the stock market is no exception. If you look back at past market crashes, you may see patterns that could indicate an upcoming market crash.
For example, if the market has been in a bull market for an extended period, a market correction or crash could be around the corner.
According to data, the average bull market lasts just over four years, with the longest bull market in US history lasting nearly 11 years (1990-2000).

Excessive Leverage
Excessive leverage, or borrowing too much money to invest in the stock market, can increase the risk of a market crash.
When the market is going well, leverage can amplify gains, but when the market turns, the losses can be magnified, leading to a market crash.
According to a report by the Bank for International Settlements, excessive leverage was a key factor in the 2008 financial crisis, with many financial institutions borrowing far more than they could afford to repay.

Unsustainable Market Growth
Unsustainable market growth, or rapid growth in the stock market without a corresponding increase in underlying economic fundamentals, can be a sign of a market bubble that could eventually burst. This can lead to a market crash, as investors exit the market and prices decline.
To identify unsustainable market growth, look at market indices such as the S&P 500 and compare their growth rate to the growth rate of the overall economy. For example, during the dot-com bubble, the S&P 500 grew by over 200% in just five years, far outpacing the growth of the economy.
Political Uncertainty
Political uncertainty, such as impending elections or changes in government policies, can create instability in the stock market.
This can lead to increased volatility and a potential market crash, as investors become nervous and exit the market.
For example, the Brexit vote in 2016 caused significant uncertainty in the global stock markets, with many indices declining in the weeks leading up to the vote.

Rising Interest Rates
Rising interest rates can be a sign of an upcoming market crash, as higher interest rates can make borrowing more expensive, slow economic growth, and reduce consumer spending.
This can lead to a decline in company profits and, as a result, a decline in stock prices. For example, prior to the 2008 financial crisis, the Federal Reserve raised interest rates several times, contributing to the housing market collapse and the subsequent stock market crash.
Insider Selling
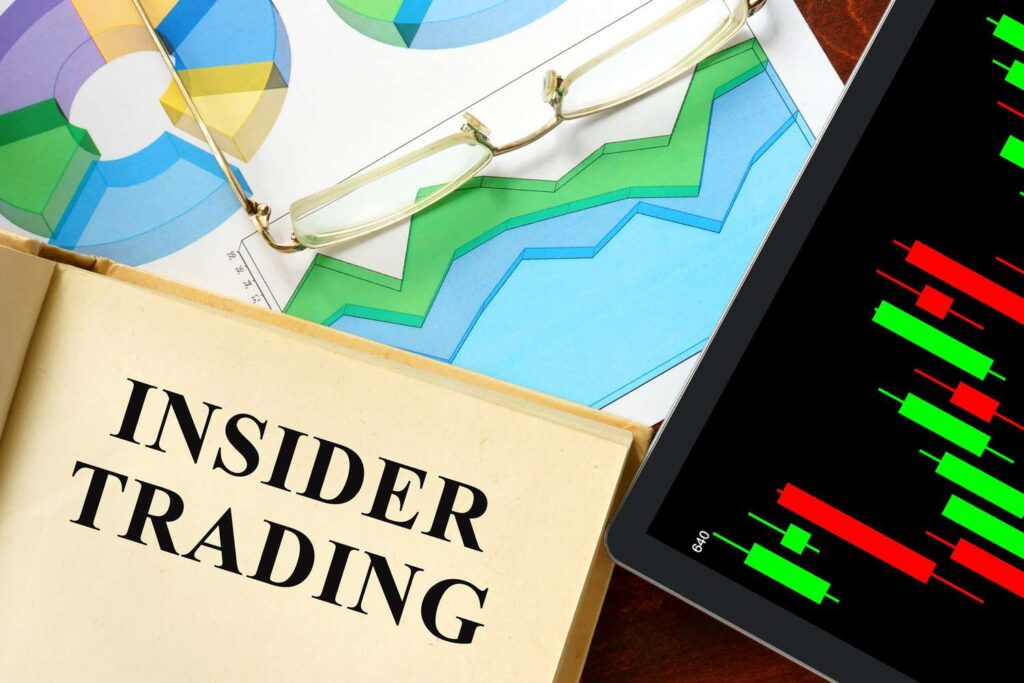
Insider selling, or the sale of stock by company executives and insiders, can be a sign that they believe the stock price will soon decline. If a large number of insiders are selling, it could indicate that a market crash is imminent.
For example, prior to the 2008 financial crisis, many executives and insiders sold large amounts of stock, indicating that they believed the market was about to decline.
In conclusion, these are ten signs that you should watch for to help protect your investments in the stock market. Remember that no single sign can guarantee an upcoming market crash, but by being aware of these signs and staying informed, you can be better prepared for any potential market turbulence. It’s important to have a well-diversified portfolio and to always consult with a financial advisor before making any investment decisions. Check out our other articles here and kickstart your investing journey!
