

What is a Stock Market Chart?
- A Stock Market Chart is a tool that gives you a glance at stock prices over a fixed period of time. These charts are crucial in identifying price trends in the stock market. Stock price charts can trigger buying and selling, and give insight into future price trends of the stock, in a graphical representation.
Types Of Stock Charts
- Line Charts: This type of chart plots the ending price of a stock after each trading session. This eventually forms a line. As we take longer time periods for these line graphs, the lines slowly become curves, and the ups and downs of the market are levelled out.
- Daily Bar Charts: This chart is one of the most useful charts. It is commonly used for traders. This type of chart shows the opening and closing price, and the highest and lowest price of a stock, in a particular day. This is extremely useful, as traders can come up with price trends, and position themselves for upcoming trading sessions.
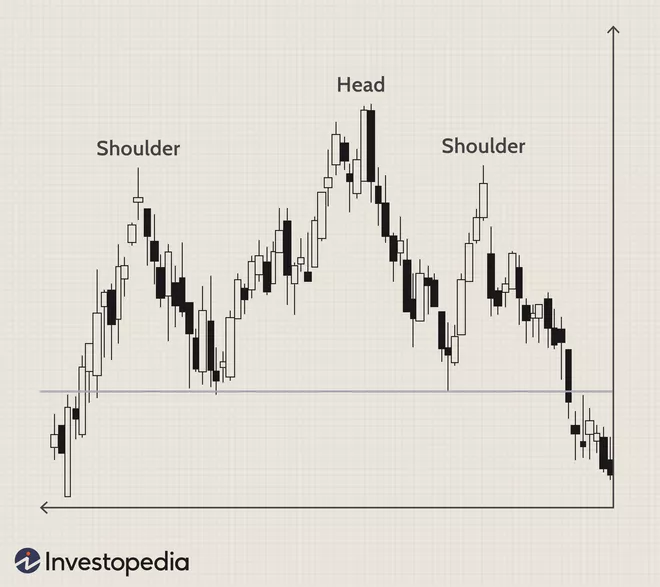
- Head and Shoulder Charts: This type of chart is a reversal chart pattern, and it signals the movement of stocks. This chart is useful to predict whether a stock is likely to move against a previous trend.
- Top: This peak signals that a stock has reached its peak, and is about to fall
- Bottom: This low signals that a downward trend is about to end.


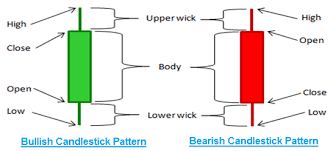
- Candlestick Charts: This chart reflects the same data, in a different method. The thin lines show the high and low price range, and the body shows the difference between opening and closing prices.
How to use these charts?
- Identify the company: Identify which security you would like to trade, and which type of chart would best benefit you. For example, if you were planning a long term trade, a candlestick chart would be redundant, but a line chart would be more sensible to look at.
- Identify the time window: Once you have identified the security, look for the time window. Based on the time frame, you will be able to decide whether technical analysis or fundamental analysis would be better. Based on this, you can decide if a heavy technical analysis is needed, or a light technical analysis is needed. For example, if you were planning a long term trade, a candlestick chart would be redundant, but a line chart would be more sensible to look at.
- Track the prices: Look at the price of stocks using these charts. Track whether the stock is closing below the opening price, or above the opening price.
- Look at the moving averages: The moving averages can tell you about the general price trends of a stock. Comparing these charts to the moving averages are extremely helpful.